
Today I attended not one, but two, seminars on CLTS. The first was Britta Augsburg presenting results of a recent cRCT of a WaterAid CLTS intervention in Nigeria (at LSHTM). The second was Dale Whittington reflecting on CLTS trials in the last few years and his recent CBA paper incorporating their results (at Oxford). A key theme from both is targeting. Britta’s analysis shows that interventions should be targeted at the settings in which they are most likely to be most effective. Dale’s analysis shows that resources should be targeted to places where net benefits can be maximized.
1. Britta’s presentation
Brief overview
Britta presented the results of a cRCT reported in this IFS working paper (soon to be updated) which evaluated a 2014 CLTS intervention by WaterAid Nigeria. They found that the intervention achieved only a 3 percentage point decrease in OD (at the very low end of recent experience). That doesn’t necessarily reflect well on the quality of implementation, but it’s not the most important result. More intriguing is the sub-group analysis they did for community-level wealth measures. Looking separately at ‘richer’ and ‘poorer’ communities (as defined by asset wealth), they found a 9pp decrease in OD in the poorer communities and no significant decrease in the richer communities. It’s a carefully done piece of work – they went to great pains to show that this key result is robust to different SES measures and not driven by baseline differences in sanitation coverage (see table 5, p.19 in the paper).
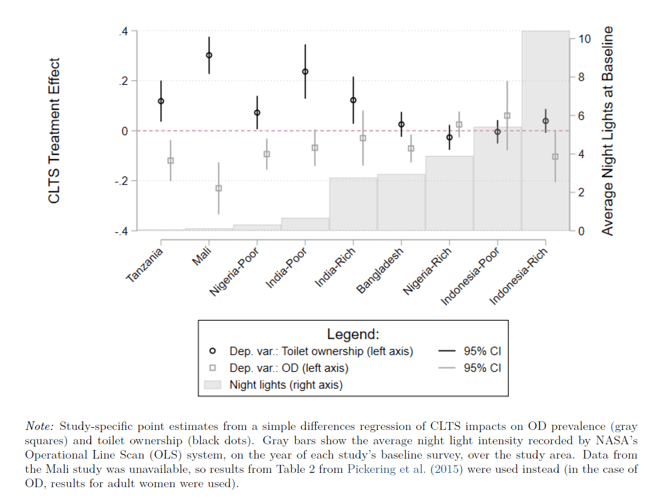
Most importantly for external validity, they reanalyse data from other trials and find that impacts on OD are stronger in poorer contexts in those settings too – see figure below (from the PPT, updated since the paper). This is an important insight. Read the left and right axes first – in short, it is plotting treatment effects by study and the average ‘night light index’ over the areas of study at baseline (a proxy for economic activity). The figure shows that the higher the night light index, the more likely the study was to report statistically insignificant reductions in OD. In other words, “heterogeneity in CLTS impacts across studies can be rationalised by differences in the average area wealth”.
My reflections
- The analysis is notable for looking at wealth effects at the community level rather than the household level.
- The wealth effect is an appealing idea, but if correct, why does community wealth affect CLTS effectiveness? A lot of the avenues they tested for this (community social interactions, public infrastructure, leader characteristics) were not statistically significant as drivers of CLTS effectiveness (nb. this was in the PPT but not the working paper – assume it will be in new version). So, the wealth measure is picking up something, but it’s not clear what it is?
- Britta argued that the effect is strong enough to be used to target CLTS in the right places, especially since asset data is widely available in DHS. In other words, secondary data can be used to target CLTS intervention in poor areas with high OD, where it is more likely to be effective. These are probably areas of greater need, too, so it is not a hard sell (except that implementers may well face higher costs in poorer areas as they may be harder to reach).
- Note that this intervention was pretty light-touch, only 1 day of CLTS activities. Almost all triggerings did defecation mapping and action planning, but almost none did transect walks, graphic exercises, and medical expenses calculations. Follow-up was also light-touch (see bottom of p.5). Would the effect have been greater (and the wealth effect more or less visible) if the intervention had been more intensive?
2. Dale’s presentation
Brief overview
Dale summarised the rationale for CLTS, reflected on the 10 or so recent sanitation trials, mostly funded by BMGF to the tune of c.$100m. He set out that a lot of these trials showed weak evidence for the impact of CLTS, with limited impacts even on reducing OD in many cases. This is not news, but his argument was a more subtle economic one: CLTS interventions are essentially risky investments. Despite this, uncertainty around costs, and especially benefits, is not much considered by sanitation advocates. He argued this with reference to a cost-benefit model of a hypothetical intervention, set out in this working paper. That model further elaborates earlier versions he (with co-authors) has been applying since 2008, and in an important version in 2012.
The main conclusions from the model are that while CLTS has a positive NPV only about two thirds of the time in their probabilistic sensitivity analysis. The BCR is rarely close to the high values of 5-7 seen in global studies like Hutton’s in 2012 and 2015. Rather, it is 1.5 on average in the base case (ranging from 0.6 – 2.3 depending on the level of uptake). In summary, his is a more skeptical (or perhaps, realistic) take on the economic performance of sanitation. The argument was not that we shouldn’t do sanitation programmes / CLTS, but that we need to be much more careful about selecting where we do them, and that ‘global silver bullet’ interventions shouldn’t be blindly applied in very diverse contexts.
He ended by pondering whether, in dirty environments with multiple exposure pathways for pathogens, making marginal tweaks to toilets or similar is going to change very much. Substantial gains in public health may only be made by upgrading all of housing, roads, drainage, WASH etc. Timing and sequencing are likely to matter. As asides, he also noted (i) the hubris of many of the RCT teams in flagging the importance of non-health benefits in their conclusions but mostly neglecting to measure them, (ii) the fact that almost none of these trials seem to have collected data on costs, or other data that would allow economic evaluations.
My reflections
- The basic argument and results in the new paper are not so different from the 2012 paper. However, the new model makes substantial innovations, such as:
- Synthesising effectiveness evidence on the most recent RCTs on CLTS
- Presenting results with and without a “sanitation externality” effect and, crucially, showing that it doesn’t make that much difference to the economic performance.
- modelling at the level of a district of 100,000 people, thereby allowing for heterogeneous effects (high / medium / low uptake) in different villages.
- These innovations are important because they make the conclusions even more convincing that previous iterations. In the first year of my PhD I read pretty much every sanitation economic evaluation ever done (at least, all the CEAs and CBAs on this list), and this new model is now the benchmark for comprehensiveness.
- His concluding point about needing to change multiple environmental conditions to see substantial public health gains reminded me of this Gambian natural experiment published a few months ago. It supports the argument that very high environmental conditions are needed to close the stunting gap.*
- The point about people not bothering to measure non-health effects is close to my heart. Half my PhD is about developing a measure of ‘sanitation-related quality of life’ (SanQoL) that would aim to make measuring these outcomes more routine in trials and in general M&E. More on that in due course…
- That so many well-funded WASH trials not including any economic component is close to scandalous. In the UK, for example, it is more or less the norm for health trials funded by the NIHR to include an economic evaluation component. Of course, my health economist colleagues still manage to gripe about not being given enough time or not being brought onto the team at the design stage. It is similar in global health trials, but at least the work is done and having an economics component is the norm. In WASH we seem to completely ignore economics in most trials (e.g. costing, cost-effectiveness, cost-benefit) , as if decisions will be made on effectiveness alone.
3. Conclusion
In conclusion, given recent trials, the benefits of CLTS are probably lower on average than we thought. Given the Crocker (2017) costing study the costs of CLTS are probably higher on average than we thought. However, the whole point of both Britta and Dale’s presentations is that the average is not that helpful. Interventions should be targeted at the settings in which they are most likely to be most effective (and not used at all in places where they aren’t likely to be). Furthermore, resources should be targeted to places where net benefits can be maximized. For CLTS, if Britta’s analysis is correct, these places are fortunately also likely to be those that most need support.
* this isn’t the place to discuss the Gambia study in more detail, but it has some limitations: (i) very small sample, (ii) the key analysis, involving splitting the 1A/1B groups, was not planned ex ante (leaving it open to accusations of p-hacking), (iii) we don’t know why the 1A group lived on the MRC compound but 1B didn’t, (iv) we would need to know more about hygiene behaviours, toilet type and animal contacts to drawn stronger conclusions. This doesn’t take away from that fact that it’s a very interesting study, and the differences between 1A and 1B are substantial.

Very interesting reviews Ian, thank you! On costing CLTS and rural interventions, are you aware of the work WaterAid, Plan and Unicef are doing? On https://washmatters.wateraid.org/publications/rethinking-rural-sanitation
LikeLike
thanks Remi – knew this was happening but didn’t realise it was finished – nice one. Will take a proper look. So is WaterAid going to start publishing costing studies of its rural san programmes? That would be great… See unit cost repository currently being worked on by PS-Eau.
LikeLike
Hi Ian,
Thanks for sharing, great to have more info on the effectiveness, impact and cost of CLTS.
A quick thought from myself:
Many of my colleagues have found that when going district-wide with achieving ODF, starting from low sanitation coverage to about 60% ODF is generally easier and then it gets incrementally harder as you get closer to the 100% mark. General assumption was that these are the poorest communities/HHs and the most vulnerable populations as you go for the ‘last mile’, maybe the final population segments are more nuanced with many of the richest communities to be considered amongst the hardest for a number of contexts?
LikeLike