
The Indus valley civilisation (c.2,000 BCE) coupled on-plot water supply from wells with the first known sewers. However, it was the Minoans (also c.2,000 BCE) who were the first to have piped water systems – I marvelled at the clay pipes and stone sewers at Knossos on Crete. The Minoans understood that piped water on demand provided a better service than carrying it in jars. Their piped systems are likely to have cost more than alternatives, especially in a slave-owning society where labour was “cheap”/free. But the richer households of Knossos were willing to pay for that higher level of service.
Turning to modern day sanitation, a high level of service such as a sewer connection is going to cost more than an unimproved pit latrine, but also provide more benefits. By extension, each movement up the rungs of the sanitation ladder has incremental costs and incremental benefits. Note that ‘incremental’ is different from ‘marginal’ – in welfare economics marginal benefit is strictly speaking the additional satisfaction or “utility” we receive from an additional unit of a good or service (e.g. from an additional litre of water). Incremental benefit, however, can refer to any change in the output of interest.
It was thinking about this, and playing with the cost data in Hutton & Varughese’s 2016 report on SDG costs, which led me to produce the below chart. It aims to visualise which incremental benefits are associated with the incremental cost of an increase in sanitation service level. For example, the movement from open defecation to a private but unimproved pit latrine is associated with time savings and ideally some privacy and security too (depending on the superstructure). This movement has a fairly small annualised life-cycle cost per household, which is even lower if the latrine is shared with other households. Achieving such a service level increase might be the objective of many CLTS programmes.
The bars are ‘annualised life-cycle costs per household’ of that option (comprising hardware/software CapEx, OpEx and CapManEx). The coloured text qualitatively describes possible incremental benefits of moving up to that rung on the ladder, from the previous.
Figure 1: Incremental benefits of moving up the sanitation ladder, alongside costs of different levels of sanitation service (average for Sub-Saharan Africa)
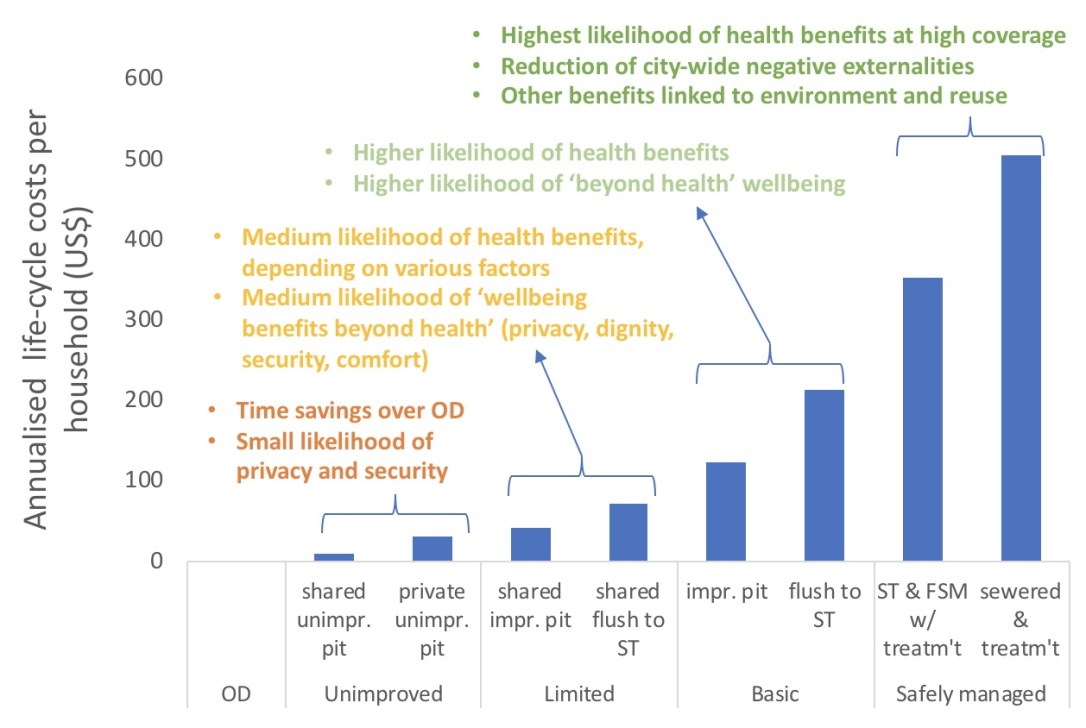
A similar logic applies to the other increases in service level. Moving from an unimproved pit to an improved-but-shared system (“limited” in SDG terms) can bring health benefits in the right circumstances, as well as some ‘wellbeing benefits beyond health’ such as privacy, dignity, security and comfort. However, many factors will determine whether these benefits are realised, including consistency of use, cleanliness of the facility, the sanitation practices of the rest of the community, and many more. For the move to ‘basic’ services, there is evidence for higher benefits over ‘limited’ services but it is mixed – no space to go into that here. Finally, the move to safely managed services (whether non-networked with FSM or networked sewerage) is where significant health benefits community-wide should be seen, through the removal of negative externalities once a high enough proportion of people are at that service level.
The cost data comes from Hutton & Varughese 2016 – the World Bank has helpfully published the dataset here. I used their raw data for urban areas for four technology options, reported in annualised per capita life-cycle costs: (i) cost of any pit latrine, (ii) cost of a septic tank system, (iii) incremental cost of septic tank system with FSM, and (iv) incremental cost of sewerage with treatment. Since the latter two are incremental costs, I added them to the cost of a septic system to get the total cost. I calculated the average for Sub-Saharan African countries, and then used assumptions as follows: I assumed a household size of 5 to get to per household costs, and an assumption of 3 households sharing to get to the shared estimates. Finally, an unimproved pit was assumed to cost 25% of an improved pit.
The figure above represents a simplification of reality, since all benefits rely on contextual factors – note the ‘likelihood’ framing in the figure. Around 1,000 people building and using improved pit latrines is likely to have a bigger health effect in a village of 1,200 people than in a city of 1 million, depending on the baseline situation. Similarly, a new borehole is likely to have more benefits in a village where everybody drinks from the river, than in a village where most people already have piped water.
Furthermore, there are other economic benefits from different levels of service, such as avoided healthcare costs and time wasted in sickness or caregiving, or the potential value of resource reuse. Nonetheless, I think the figure represents a useful way to think about what we get for our money when we invest in higher levels of service.
Has someone else visualised incremental costs/benefits before, like this or in a different way (I couldn’t find anything)?
What would you improve about the figure? Do comment below.

1 thought on “Incremental benefits from increases in sanitation service level”