
UNPD brought out their 2017 update to World Population Prospects (WPP) last summer. One striking graph from that got me digging into the data into the 2014 World Urbanisation Prospects (WUP) data.
This may seem slightly off-topic for a WASH economics blog, but understanding population trends is crucial in economics. For costing purposes, you’ll often find yourself multiplying a per household or per person unit cost, by a number of households or people. That’s true whether you’re estimating the costs of reaching the SDGs at the global level, carrying out strategic financial planning at the national level, or understanding how to finance a sanitation master plan at the city level.
So, the future is African. This becomes obvious, when looking at the figure below from WPP 2017. A lot can happen between now and 2100, but the trend for the African continent is striking. Even at 2050 (not that far away, scarily) the absolute numbers are striking, with Africa seeing a ~150% increase on its 2010 total population.

The future is also urban, even in low- and middle-income regions which are now predominantly rural. I made the below graph based on WUP 2014 data. The solid lines show absolute urban population numbers for low income countries (LICs), lower-middle income countries (LMICs) and upper-middle income countries (UMICs). The dashed lines show the figures for rural areas of the same classifications. It would be straightforward to produce a similar graph by region from the WUP 2014 data, and I’ll get around to that at some point.
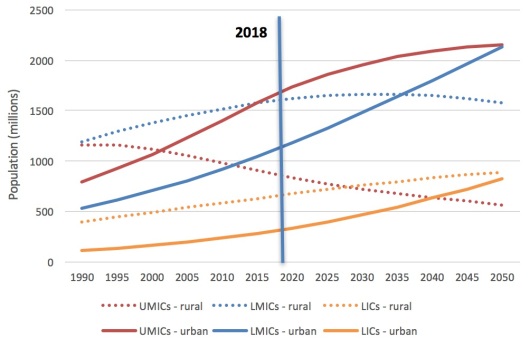
Income classifications are the World Bank’s from 2012 – this OECD list approximates which countries were in which groupings around that time. As with any categorisations like this, big countries dominate. In the present classifications, India and Nigeria are LMICs, and China is a UMIC. The classifications for 2018 are here. Using them is not uncontroversial – see an interesting critique here, and a good debate in the comments here.
From the gradients of the lines in the graph, we can see that urban populations are rising faster than rural populations in all three groupings (and UMIC rural populations are falling fast). By 2050, the urban population of countries which were LICs and LMICs in 2012 will total c.3 billion. These are countries which presently have very limited sewerage networks in urban areas.
For Sub-Saharan Africa (SSA), see the graph below I made based on the tables at the back of the JMP 2017 update. The percentage of the urban population in SSA using a toilet with a sewer connection in 2015 was only 11% (and this actually fell from 13% in 2000). Note that there may be people using sewers in the “limited” category, if the connected toilet is shared with other households.

The implication of these data? Ensuring effective non-networked sanitation service chains should be the highest priority as African cities and towns expand. That means latrines and septic tanks supported by fecal sludge management services. Of course, conventional and simplified sewerage need to be a big part of the picture. For the latter, the World Bank’s video here on the Brasilia experience shows what can be done. Hopefully by 2030 we’ll be able top look back on more African and Asian success stories of simplified sewerage, rather than always the Orangi Pilot Project and Latin American examples. Nonetheless, the fact that there has been backwards progress in African sewerage between 2000-2015 strongly suggests that non-networked sanitation is going to need the lion’s share of attention up to 2030. The city-wide inclusive sanitation initiative promises to be a useful step towards achieving a poor-inclusive approach, whatever the technology.

Great blog Ian. But when considering alternatives to sewerage, don’t forget container-based solutions: early days in development of the model, but potentially can be a much better solution in public health terms than septic tanks leaching pathogens to surface drains and groundwater. – Guy
LikeLike
thanks Guy, the way I think about non-networked includes CBS, but realise the sentence makes it look like latrine/ST the only alternative! Well spotted. I am excited about the potential for CBS in some settings. To my mind, it is only likely to be desirable where two key limiting factors are in place, leading people not to invest in permanent infrastructure. These are: (i) limited space to construct, and/or (ii) limited ability to pay up-front, but ATP/WTP if costs spread costs over time.
LikeLike
Great blog, excellent morning reading to start the day! I think it is very useful to visualise those coming changes on graphs, and in a concise blog. I think the private (micro) sector in the LICs and LMICs may be the future for dealing with growing un-sewered sanitation and FSM in the booming big cities, but also in the secondary towns, often left out of the agenda. Container-based sanitation often (if not mostly) relies on the existence and strengthening of a vibrant private sector, which tends to stay ahead of the game in terms of FSM. Now the future is also all about framing and regulating their activities.
LikeLike
Thanks Noemie. Yes, but let’s not forget the role of the public sector too. Their roles are complementary, and strengths suited to different gaps in the chain. I can’t think of many cities where a publicly-managed fleet of vacuum trucks is doing a good job. But I also can’t think of many cities where the private sector has autonomously invested in treatment or secondary transport. We need public and private to work together in areas of their respective comparative advantage – too many market failures for the private sector to do everything.
LikeLike