
I first got interested in health economics about 10 years ago when reading various chapters of Disease Control Priorities in Developing Countries (DCP2) – its third edition is currently being worked on. Ranking interventions by cost-effectiveness is a compelling way to frame discussions about prioritisation. See for example the graphic below, which comes from p.41 of this chapter of DCP2. It is often said that economics is about the efficient allocation of scarce resources, and comparison of cost-effectiveness ratios (CERs) focuses attention on exactly this.
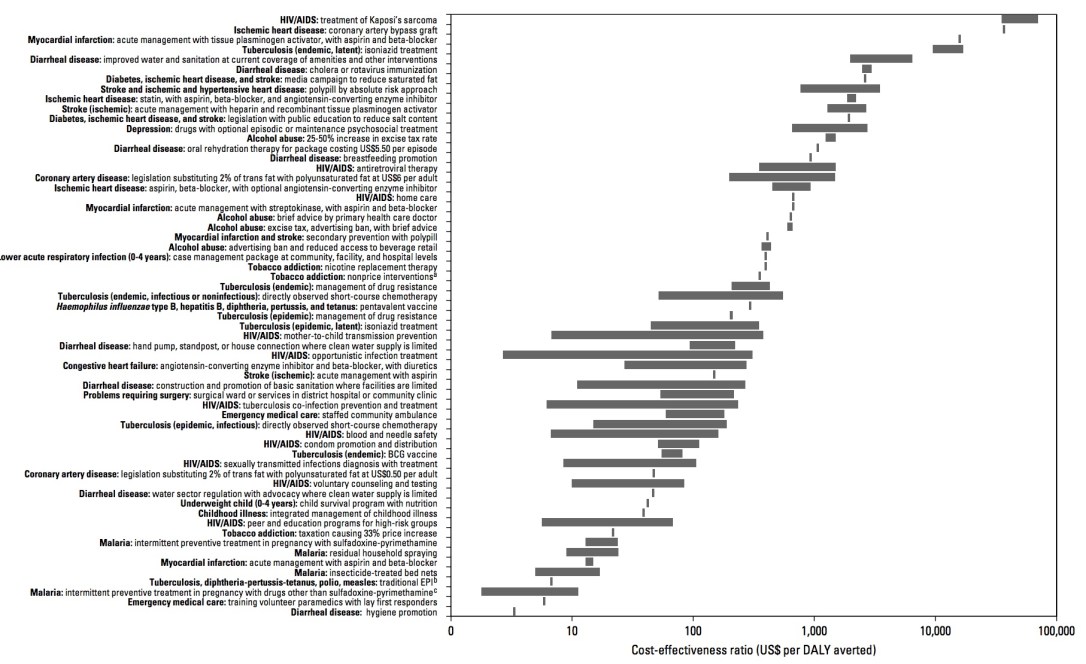
(nb. the graphic above shows the Cost-Effectiveness of Interventions Related to High-Burden Diseases in LMICs. The x-axis is log-scale in US$/DALY averted, a measure of cost-effectiveness. DALY means Disability-Adjusted Life Year, a measure of health outcome. As implied by the indicator above, we want to “avert” DALYs – in other words, to reduce death and impaired life. The various interventions are on the y-axis. Obviously, small CERs are ‘better’ than big ones – note therefore that hygiene promotion comes top of the class. Other WASH interventions come about a third of the way up. There are issues with the underlying analysis though – more on that in a future blog.)
Now working on an economic evaluation study myself (it’s my PhD topic – see here), I can appreciate just how much work underlies the graphic above. Each bar in the chart comes from a review of many, many, single studies in that field. We need to get better at economic evaluation of WASH programmes, i.e. learn from the health sector and compare WASH interventions on the basis of cost-effectiveness.
That’s all very well, but compare to what? And what is cost-effectiveness anyway? More on the latter question in another blog – here I’ll focus on how we might want to compare WASH interventions.
In the graphic above, four WASH intervention types are listed (for scenarios where there is low coverage):
- hand pump, standpost, or house connection where clean water supply is limited
- construction and promotion of basic sanitation where facilities are limited
- water sector regulation with advocacy where clean water supply is limited
- hygiene promotion
DCP2 then compares these to health interventions. For malaria, for example, the types of interventions include (i) insecticide-treated bed nets, (ii) intermittent preventive treatment in pregnancy, (iii) residual household spraying, etc.
A WASH specialist might respond to the list above by saying “but there are so many ways of doing hygiene promotion”, and a health specialist would say “the same is true for getting people to use bed nets”. So the graphic above is just a summary – the width of the bars show that ranges are given. The specific chapter on WASH in DCP2 was written by LSHTM guru Sandy Cairncross with the health economist Vivian Valdmanis. It estimates cost-effectiveness of different combinations of interventions separately – see the table below. For sanitation, “construction and promotion” is estimate at $270 per DALY averted while “promotion” is estimated at $11 / DALY.

The first thing we can do is compare WASH to WASH, and say “sanitation promotion by itself is more cost-effective than construction, so let’s not do construction programmes”. Or we might say “hygiene promotion is more cost-effective than sanitation or water programmes, so let’s invest mostly in that”.
These assessments on their own are flawed, for several reasons. Firstly, CERs may be one argument for doing something (if we trust the data), but far more should and does go into an investment decision than cost-effectiveness data. Secondly, maybe an appropriate mix of both interventions is needed depending on the context (e.g. subsidising construction only for the poorest households). Thirdly, sanitation and water interventions bring different outcomes beyond simply health-related ones. Water supply reduces the time that (mostly) women spend walking to and from water points, and have impacts beyond diarrhoea. Sanitation also impacts on stunting, soil-transmitted helminths and dignity. Comparing one to another based on only one outcome is not really “fair”. On this argument, maybe it is only fair to compare within sub-sectors rural sanitation to rural sanitation and urban water to urban water. Context also plays a huge role, something which I assessed as manager of this six-country Value for Money study, but that’s for another day…
The second thing we can do is compare WASH to other interventions, for example health interventions as the first figure above does. Someone might say: “at $11/DALY, sanitation promotion is more cost-effective than oral rehydration therapy at $1,062/DALY, so let’s not invest in that.” This would also be flawed, for the same three reasons as above. However, the third reason becomes even more powerful. “Public health” interventions such as WASH intend to prevent ill-health or promote/protect health in a population. They usually have a far broader range of outcomes than “clinical” interventions (which intend to prevent or treat illness in an individual person). Comparing sanitation promotion to a rotavirus vaccination, even though both have outcomes related to diarrhoea, is not “fair”. The vaccine only affects one outcome: diarrhoea. The sanitation intervention will get undervalued if only the diarrhoea-related outcome is considered.
This problem was identified very presciently in 1985 in this paper by the late John Briscoe. He suggested that, as use of CEA increased, it would introduce:
“systematic and serious biases in favour of specific medical interventions and against systemic environmental interventions”
Such problems are not only related to environmental interventions though – they applies to public health interventions in general, as clearly set out in this paper. The authors set out methodological options for undertaking economic evaluation of public health interventions, arguing that two things need to happen for proper valuation of their costs and benefits. These are: (i) the use of modelling that better captures effects of public health interventions (e.g. better data on behavioural outcomes), and (ii) different valuation paradigms such as the capabilities or subjective well-being approaches, which offer broader measures of value than only clinical outcomes. This is the main reason why, as part of my PhD research, I am exploring measures of sanitation outcome based on well-being.
A caveat to the above is that CEA is only one tool in the armoury of economic comparison – Cost-Benefit Analysis (CBA) removes some of the above problems (though introduces new ones) by monetising benefits. CBA therefore theoretically makes any intervention comparable – more on that another time.
In conclusion, we certainly do need to compare WASH interventions to other WASH interventions and to health interventions, in order to make inter- and intra-sectoral prioritisation decisions. However, it is important to do so using metrics which are comparable and fair. Cost-effectiveness data is only one part of the picture, but even then there is (at the moment anyway), rarely enough good economic evaluation evidence to inform such decisions.
